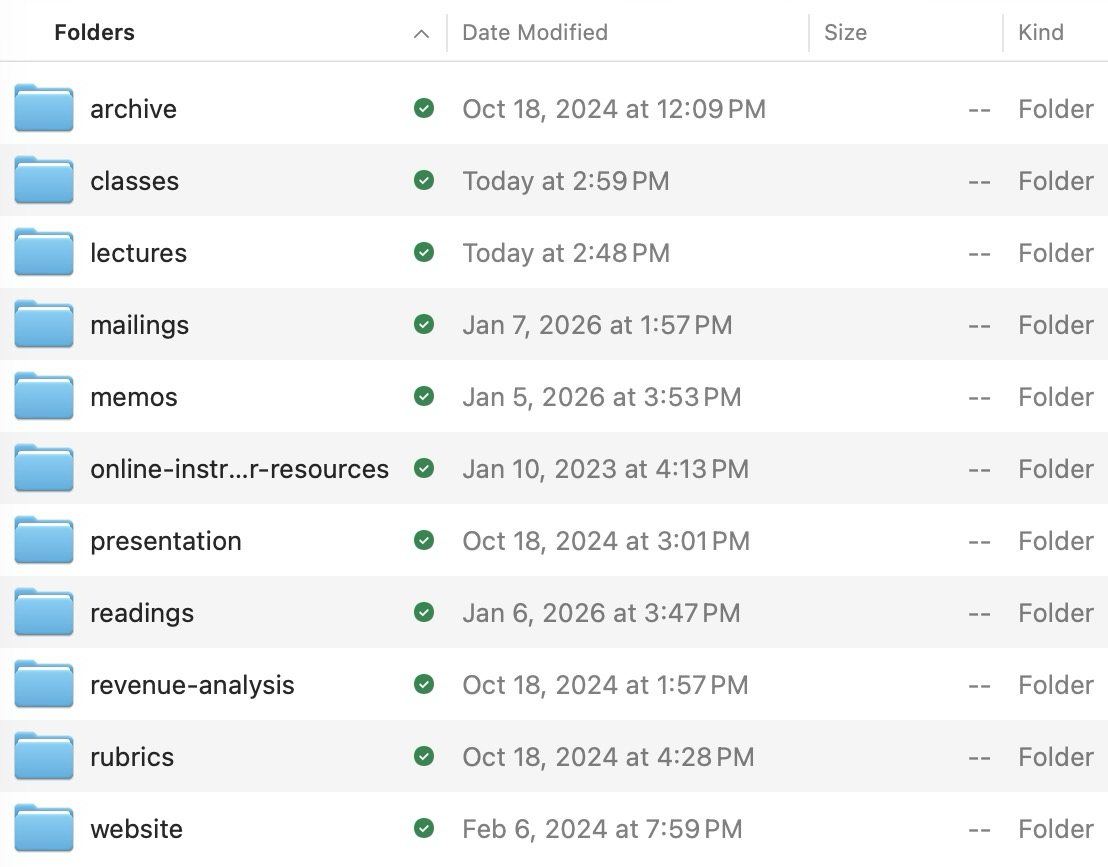
Reorganizing My Teaching Files
While there are some resources on how to organize empirical research files, there is almost nothing for teaching. This is my attempt to solve that.

Inspired by Uses This And App Defaults, this post includes a relatively up-to-date description of the stuff I use to do things.
Sorting out conference notes with Obsidian
Using Obsidian's new Apple Shortcuts support to streamline conference note-taking.

Working papers
-
Christopher B. Goodman. "Local Governments in the Age of Preemption,” Working paper.
-
Christopher B. Goodman. "Demand Shocks & Special Districts: Evidence from Chinese Import Shocks,” Working paper.
-
Christopher B. Goodman and Suzanne M. Leland. "Creative Destruction? Examining Special District Dissolution by Service Area."
-
Christopher B. Goodman. "Overlapping Jurisdictions and Residential Segregation by Race”
Current courses
Local Economic Development Policy
- Spring 2026 (synchronous online)