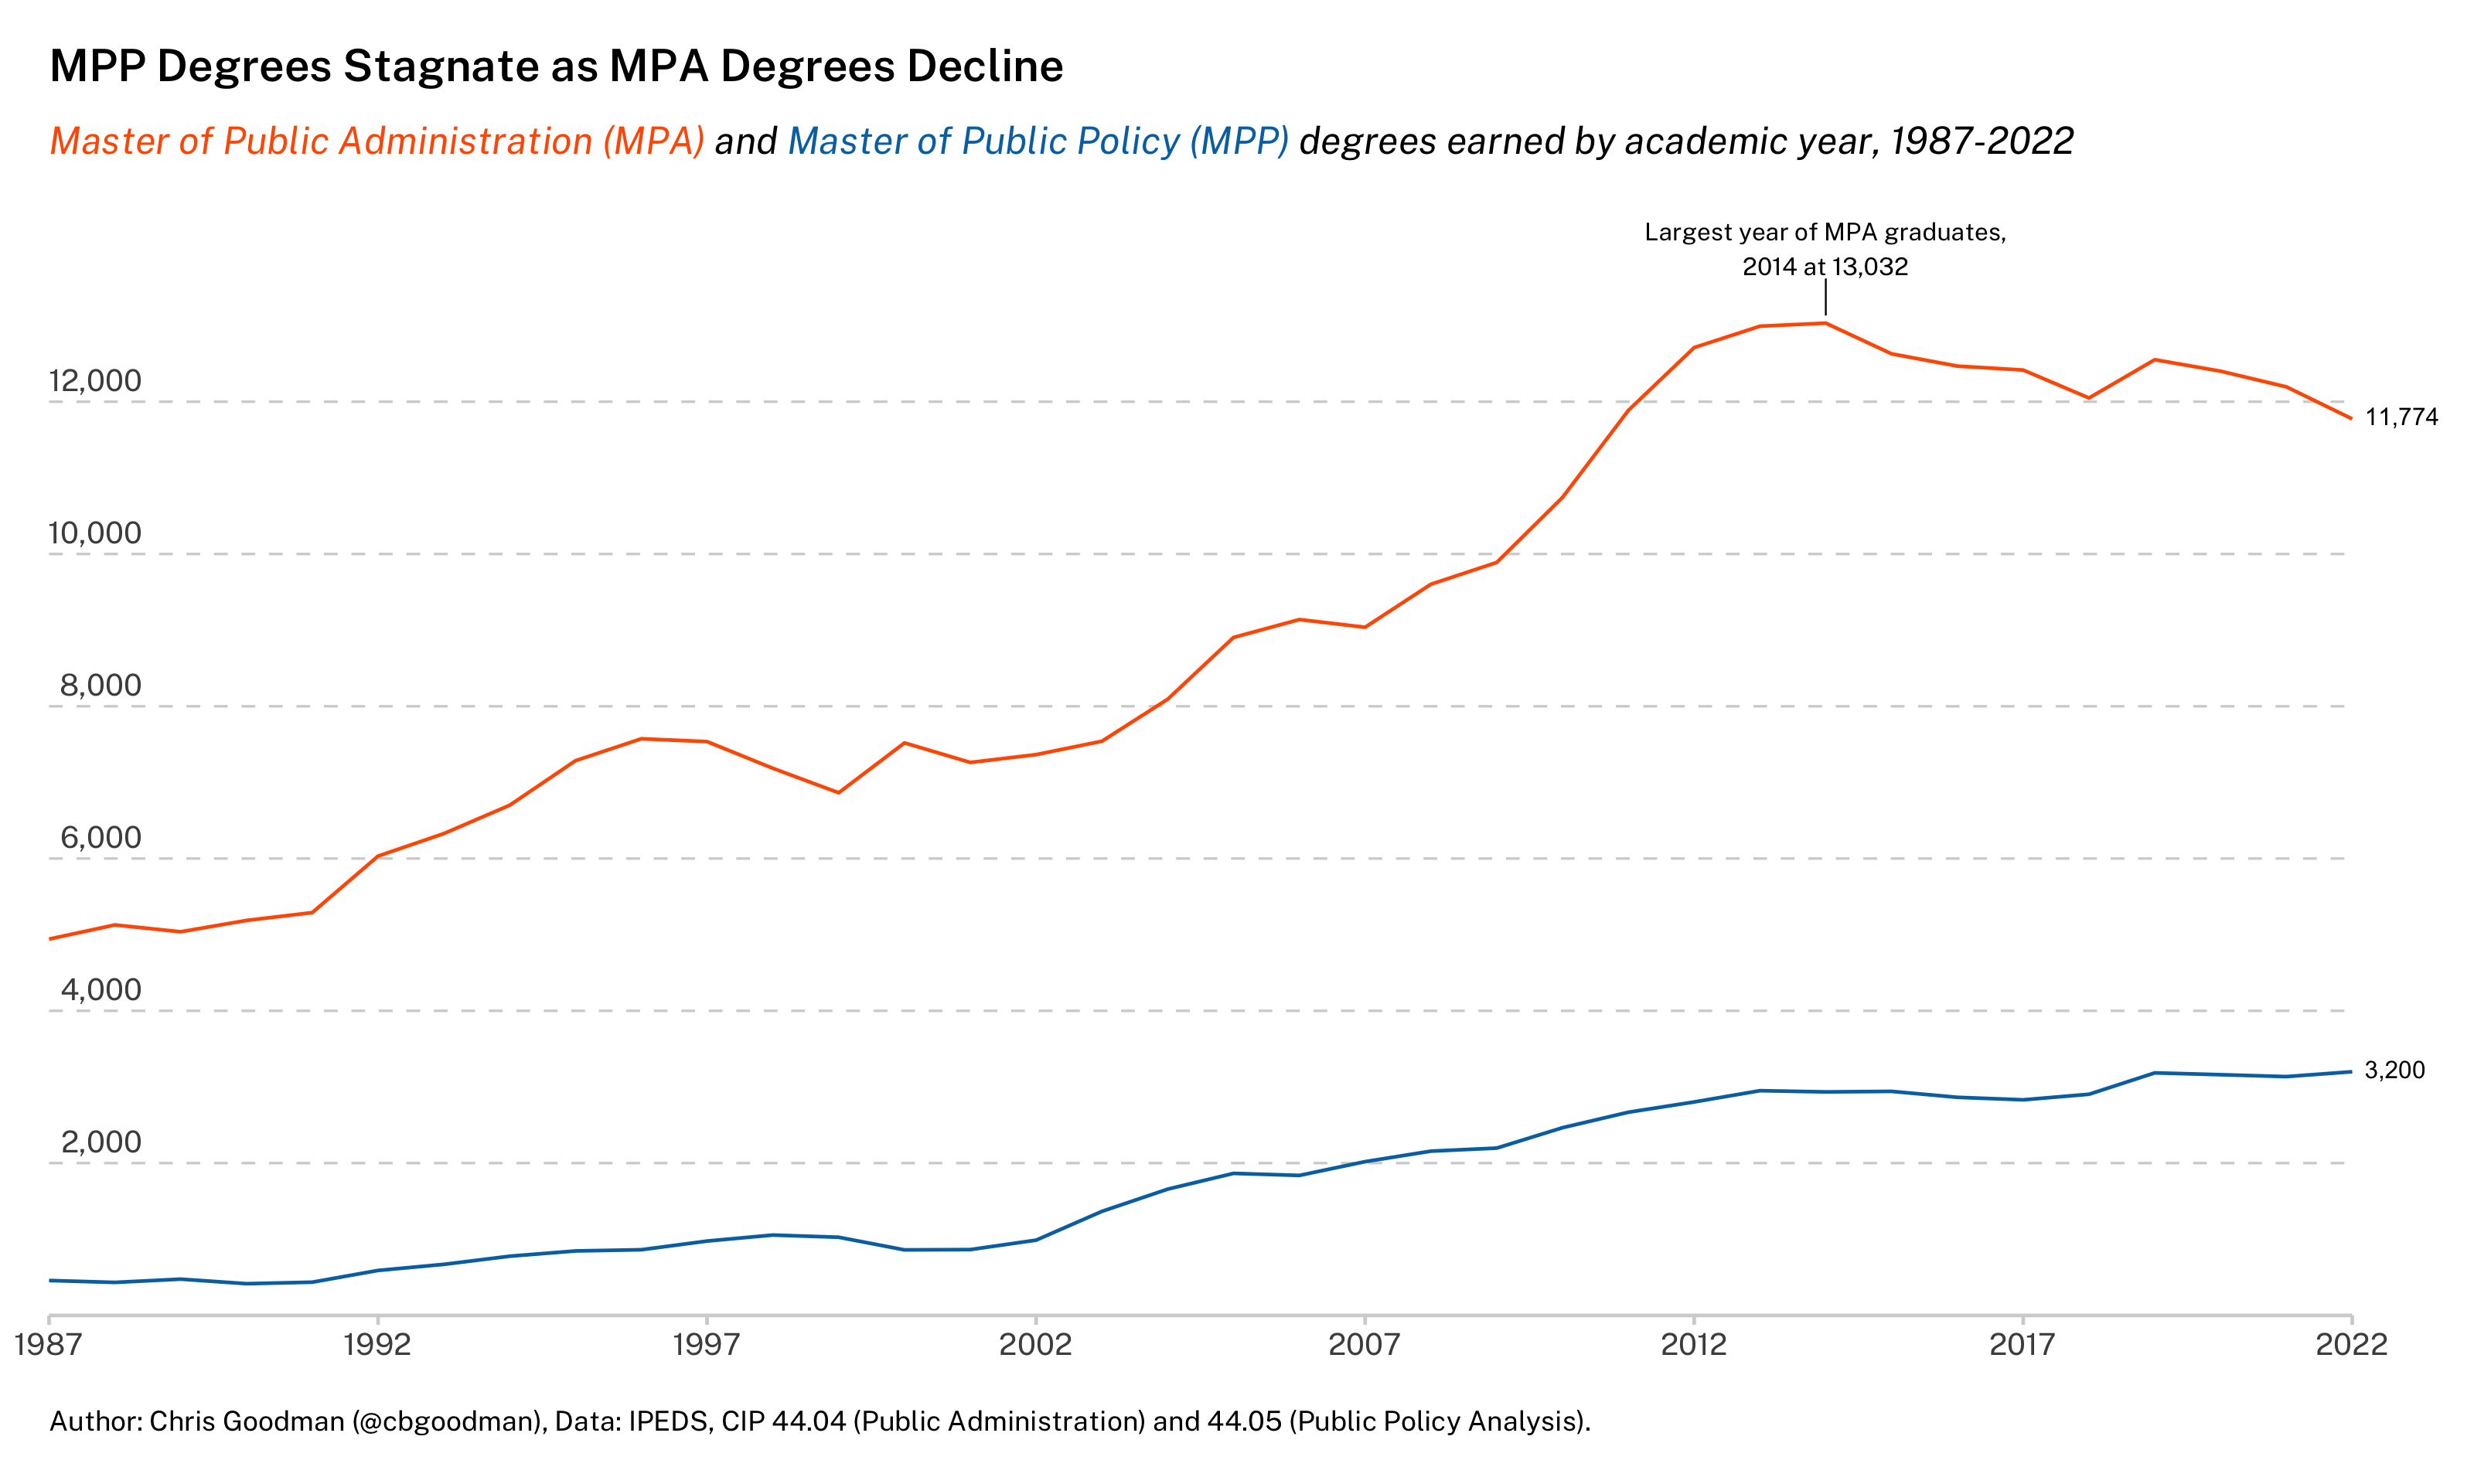
Where are all of our students?
No, you're not crazy for asking where all the students have gone.
My Necessarily Flawed List of Best or Most Interesting Articles of 2023
My list of the best or most interesting articles appearing in issues dated 2023. They are mostly local government, but some others sneak in that are important to my work in some way.
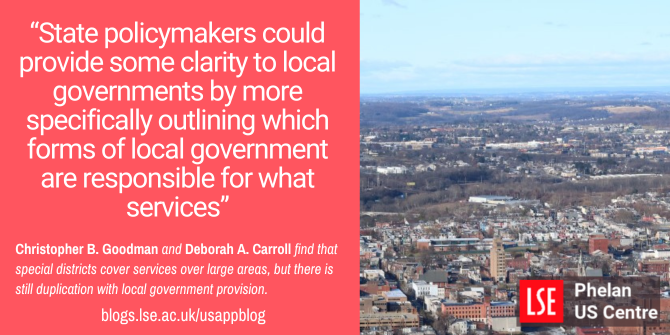
My coauthor, Deborah Carroll, and I recently had the pleasure of writing a blog post for the London School of Economic’s US Centre Blog. It covers a our recent publication in *Public Administration Review* on whether special districts are complements or substitutes for spcial districts. See below for the full text of the post as well as a link to the original.
My coauthor, Megan Hatch, and I recently had the pleasure of writing a blog post for the London School of Economic’s US Centre Blog. It covers a our recent publication in *Urban Studies* on the factors associated with the preemption of local affordable housing laws. See below for the full text of the post as well as a link to the original.

Overlapping local governments in DuPage County, IL
Local governments in United States generally overlap other local governments. It is so common that many people do not give it a second thought; however, such a situation presents an interesting data visualization problem. How do you demonstrate the complexity of local government borders--both horizontally (where do neighboring cities intersect?) and vertically (which governments overlap a particular city or parcel)? I demonstrate one method using DuPage County, IL as an example.

I recently had the pleasure of writing a blog post for the London School of Economic’s US Centre Blog. It covers a recent controversy about the Reedy Creek Improvement District -- something I have a somewhat unique perspective on as a scholar of local governments and, in particular, special districts. See below for the full text of the post as well as a link to the original.
Municipal Incorporation in the US, 1789 - 2020
I've been collecting data on the earliest date of municipal incorporation for every active municipality in the US. This project is beginning to bear fruit.
The structure of US local governments is often a poor predictor of local economic growth
I recently had the pleasure of writing a blog post for the London School of Economic’s US Centre Blog. It covers a recent publication in the *Journal of Urban Affairs* on the implications of local government structure on long-run economic growth in the US metropolitan areas. See below for the full text of the post as well as a link to the original.
Academic Project Management Notion (Update)
About a year ago, I wrote a small post about how I use Notion as a project management tool. I didn't really expect it to be as popular as it is, but I also didn't expect myself to change too much about the process either. It was working. Fast forward one, sort of over, but not really pandemic later. Things have certainly changed, sort of. This post is meant to explain some of those changes and to provide a template for anyone who wants to give this a spin.
Special Districts: America’s Shadow Governments
I recently had the pleasure of writing a short blog post for the UIC Government Finance Research Center's blog. The piece is a bit of a short explainer on special districts in the United States and a few fiscal issues that arise. It's by no means comprehensive but part of a broader focus I have on writing more popular or policy focused work on these relatively hidden local governments. Below is the intro (I don't have full re-print rights) and a link to the original.
Municipal Fragmentation in U.S. Metro Areas in 3 Maps
Over on Twitter, Dan Immergluck (GSU) asked about what municipal fragmentation in the U.S. at the metropolitan level looked like. I, an expert on local government…
The Price of Residential Street Parking
Cities, broadly, manage a number of public assets with which they provide public services. Some of those services are somewhat passive in the sense that no active labor…
Academic Project Management using Notion
I'm horribly bad at project management. It's not usually something that is specifically taught in graduate school even though it's incredibly important to an academic's professional life. There are many ways to go about this (low tech to super high tech), but the purpose of this post is to explain one tool that I have found incredibly useful and flexible. That tool is Notion (notion.so). Notion can do way more than I am going to explain (see Using Notion as Your Second Brain), but this is how I use it to keep track of writing projects throughout the process of development to publication.
Speculating on the Impact of COVID-19 on Chicagoland Property Taxes
Over on Twitter, I worked through a how the current COVID-19 pandemic might influence property taxes in the Chicagoland region (see below for a link to that thread if you…
How to Desaturate Figures for Publication using R
Many academic journals require figures in greyscale. This can be done relatively simply by printing to PDF as greyscale; however, this doesn't give you a) a way to preview what the resulting figure will look like and b) much control over the process of desaturation. If you're making figures in {R}, this process is almost as easy as the more simplistic print to PDF method.
I am teaching online again and that means recording audio lectures. A lot has changed (or I perceive it to have changed) since the last time I did this so I endeavored to find a way to record/edit all my lectures on an iPad Pro. To be clear, I made this harder on myself by restricting everything to be done on an iPad. But I want something reasonably portable in case I need to record on the go.
Recently, I was asked by a reviewer to include a large number of regression results in a manuscript I am revising. In my experience, attempting to display more than a few…
Why your sprawling, low-density suburb may be costing your local government money
I recently had the pleasure of writing a blog post for the London School of Economic’s US Centre Blog. It covers a recent publication in Public Budgeting and Finance on the…
Created in R with ggplot2. Full code and data can be found here. Data from the IPEDS Data Center for CIP 44.04 (MPA) and CIP 44.05 (MPP).
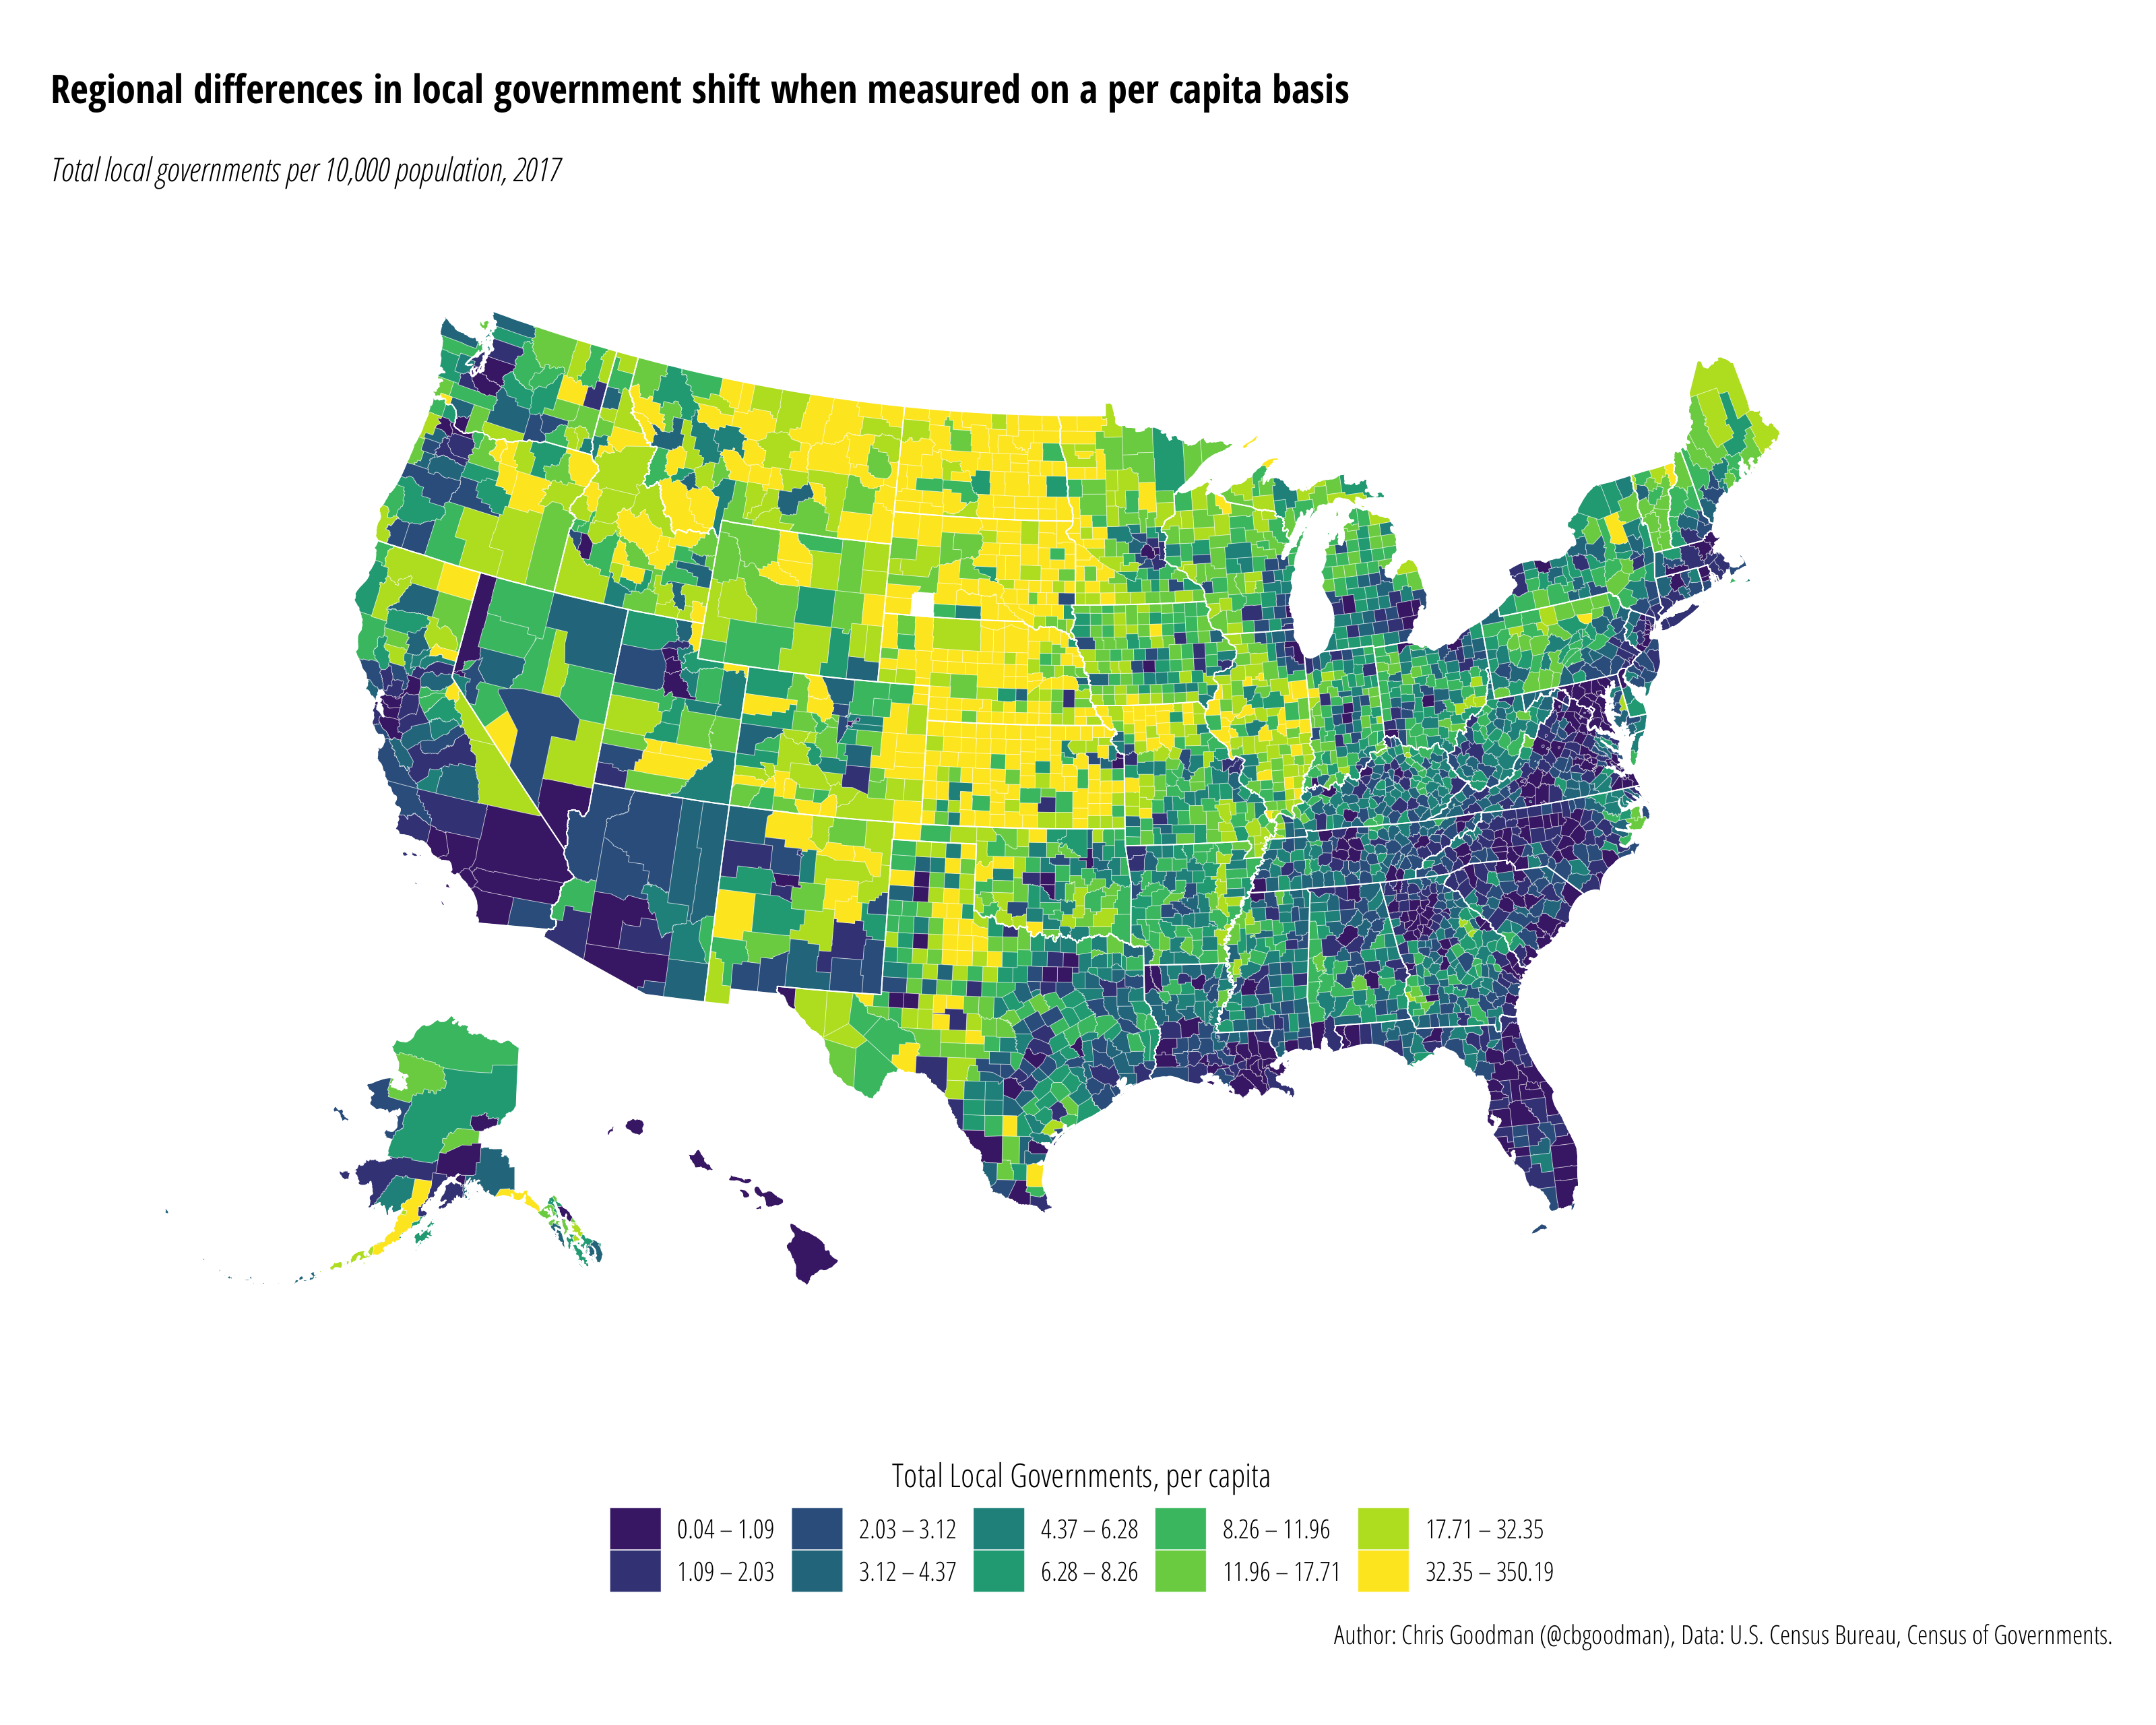
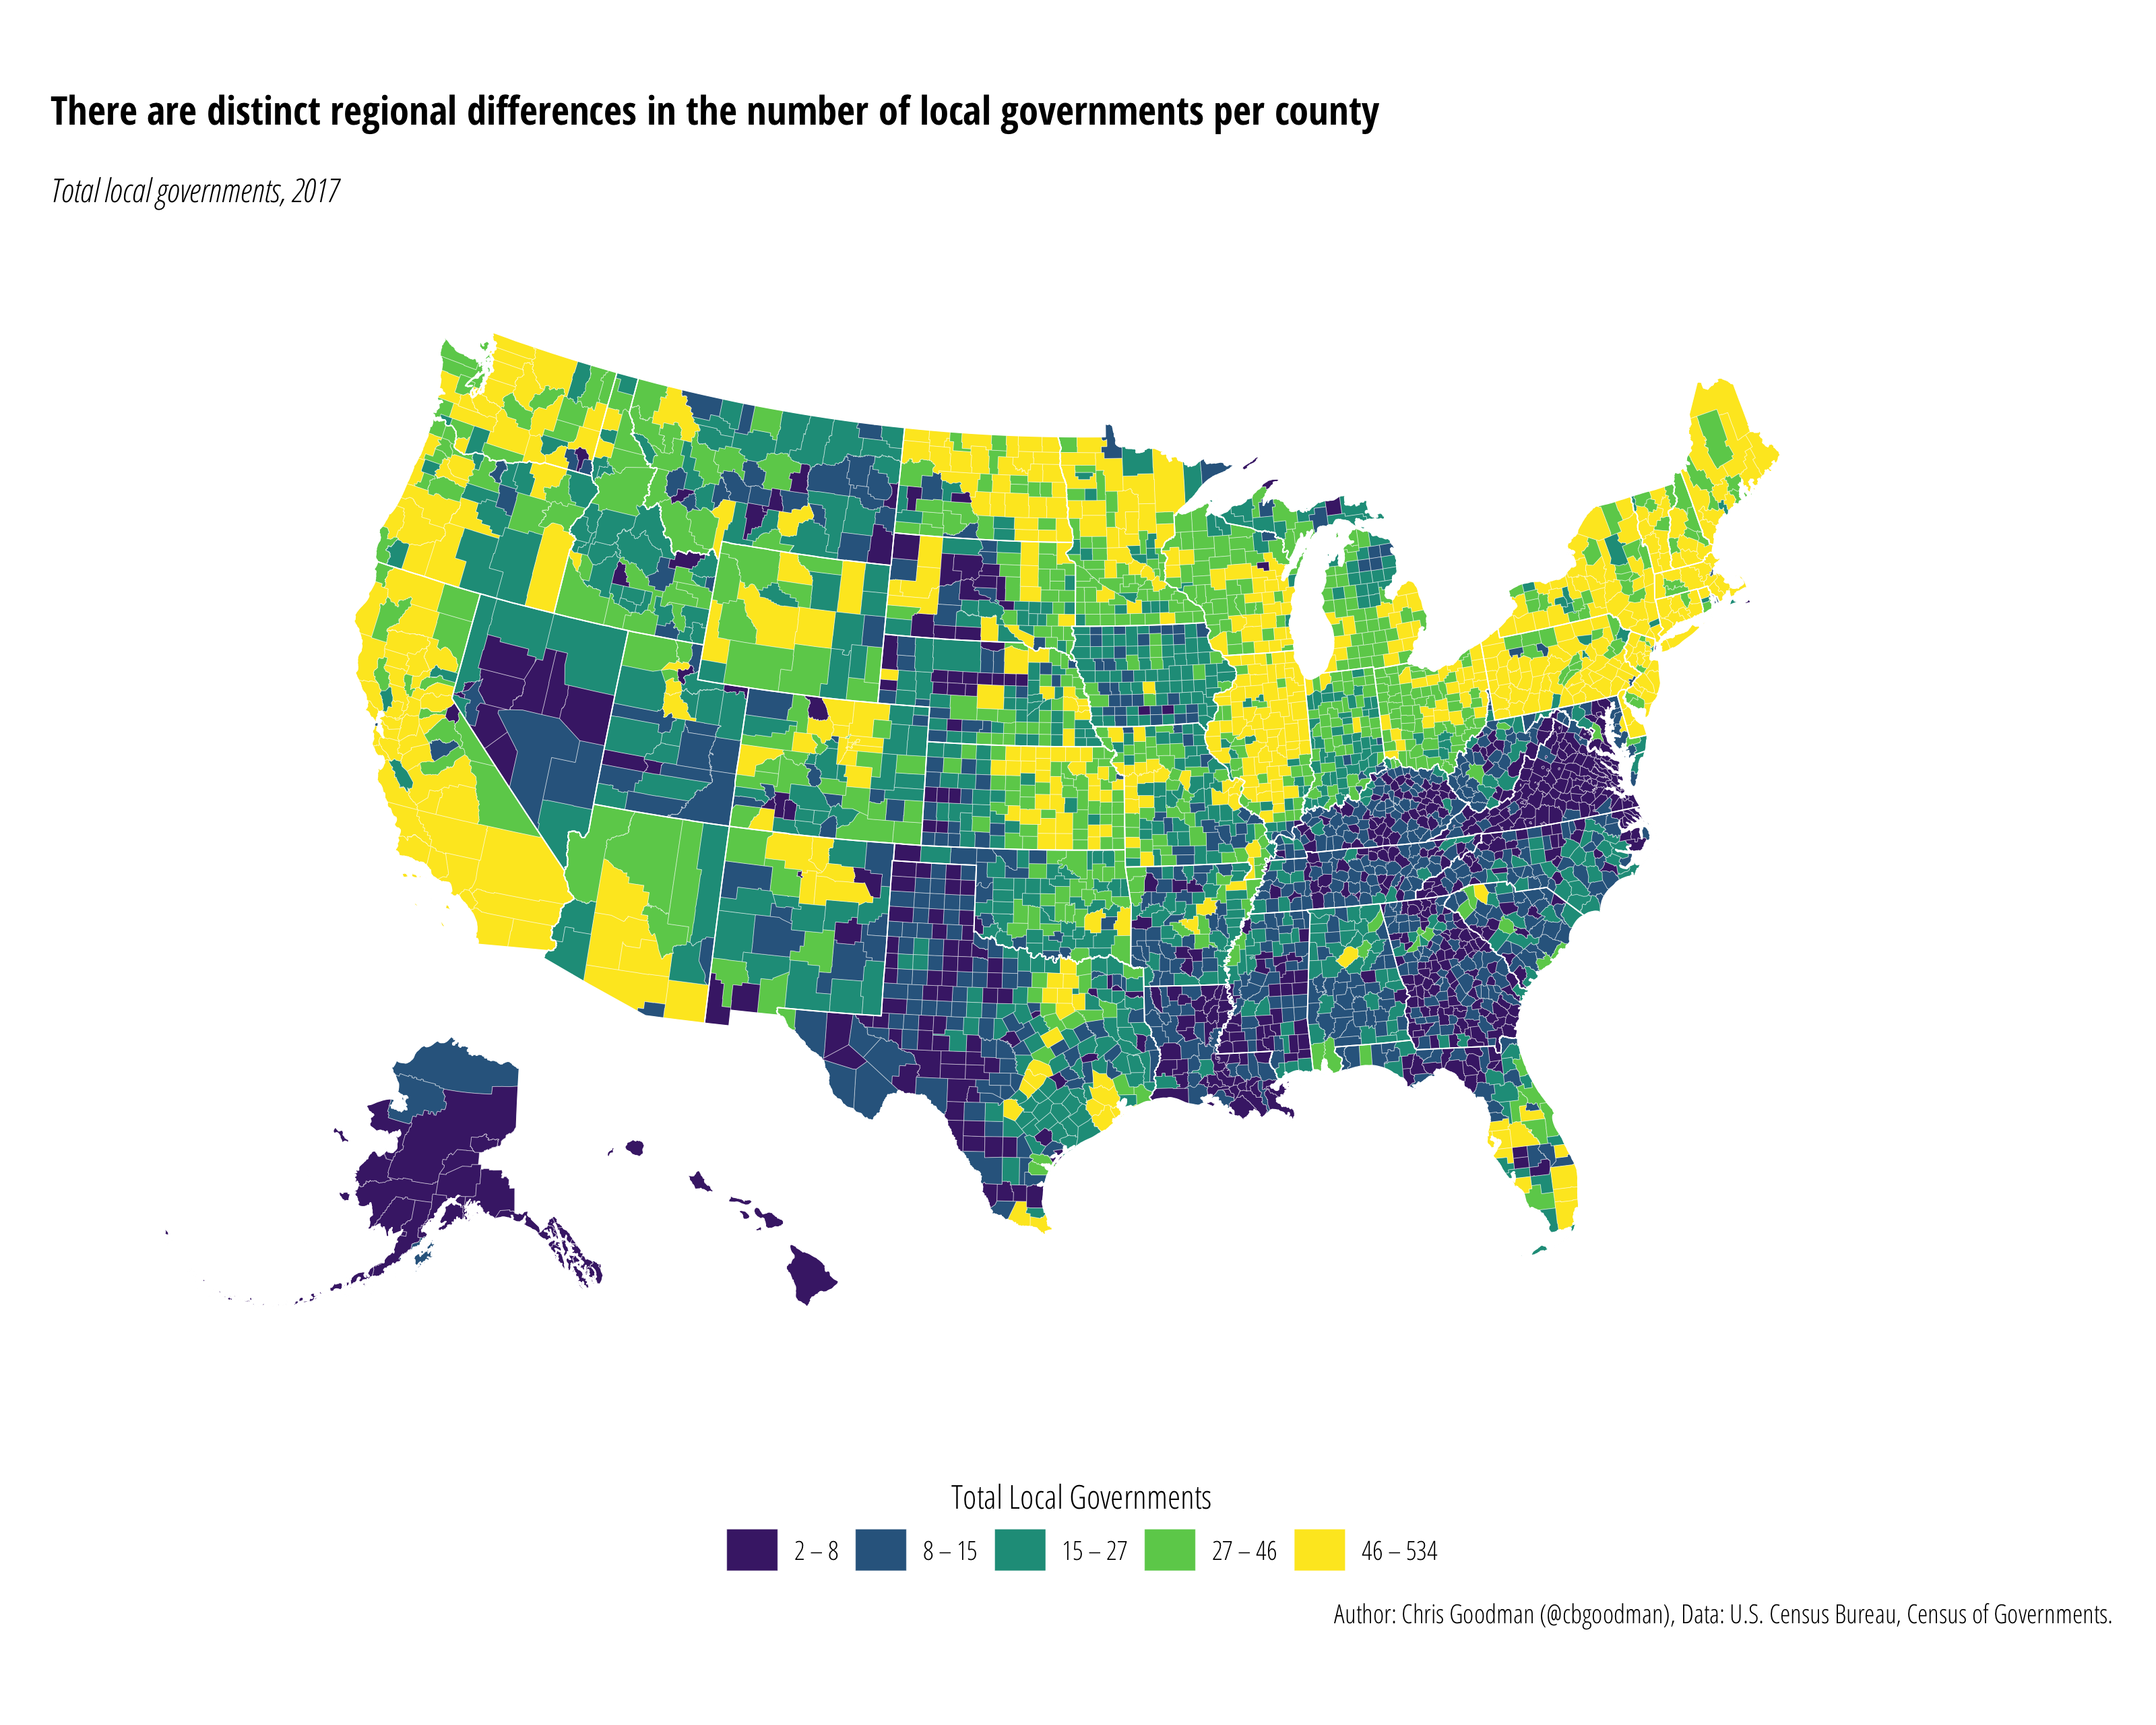
Local government overlap is calculated similar to Berry (2008) by taking the ratio of all special districts, school districts, and overlapping townships to municipalities…
Students Writing Their Own Exam Questions
Writing good exam questions is hard. If done correctly, the student should have no idea the lengths you went through to write a good set of questions. But maybe they should…
How a type of local government you may have never heard of may be costing you a bit more
I recently had the pleasure of writing a blog post for the London School of Economic’s US Centre Blog. It covers a recent publication in State and Local Government Review on…
Zipf’s law is a constant curiosity for urban observers. According to the law, the size of a city (i.e. population) is inversely related to the city’s population rank. This…
County Supervisors per 100,000 Residents
Created in with ggplot2. The relevant code is below.
Long-Run Metropolitan Economic Growth in the U.S.
Full color, stylized maps created for my working paper on local political fragmentation and economic growth. These three maps examine long-run (1960-2000) growth in…
Canadian City Councilors per 100,000 Residents
Created in with ggplot2. Full code and data can be found here.
City Councilors per 100,000 Residents
Created in with ggplot2. The relevant code is below.
Special District Creation and Dissolution
The Urban Institute has released a new package for mapping state and county data in R, urbnmapr. Their posts can be found here and here. Since I occasionally write about how…
Teaching Public Finance with John Oliver
Ever so often, I teach public finance to graduate students. I have found for many topics it helps to motivate them by providing some “real world” examples (sidenote: I hate…
State Collection of Local Government Public Finance Data
In a conversation with a few colleagues, the question came up of which states collect public finance data on their respective local governments. Over the years, I have been…
Maps in R using library(maps), Update!
I’ve previously written about how to make simple, print ready maps in R using library(maps). Unfortunately, the more recent versions the county database has some issues with…
Property Tax Reliance in U.S. County Areas
The property tax has a number of desirable properties. State and local governments have been using it in the U.S. forever, and it’s incredibly stable (up to a point, see…
My last few posts have included a large number of maps to visualize the Census of Governments’ organizations data. Rather than using a full fledged GIS program like ArcGIS…
